
How to read your Tracking dashboard
Updated August 10, 2026
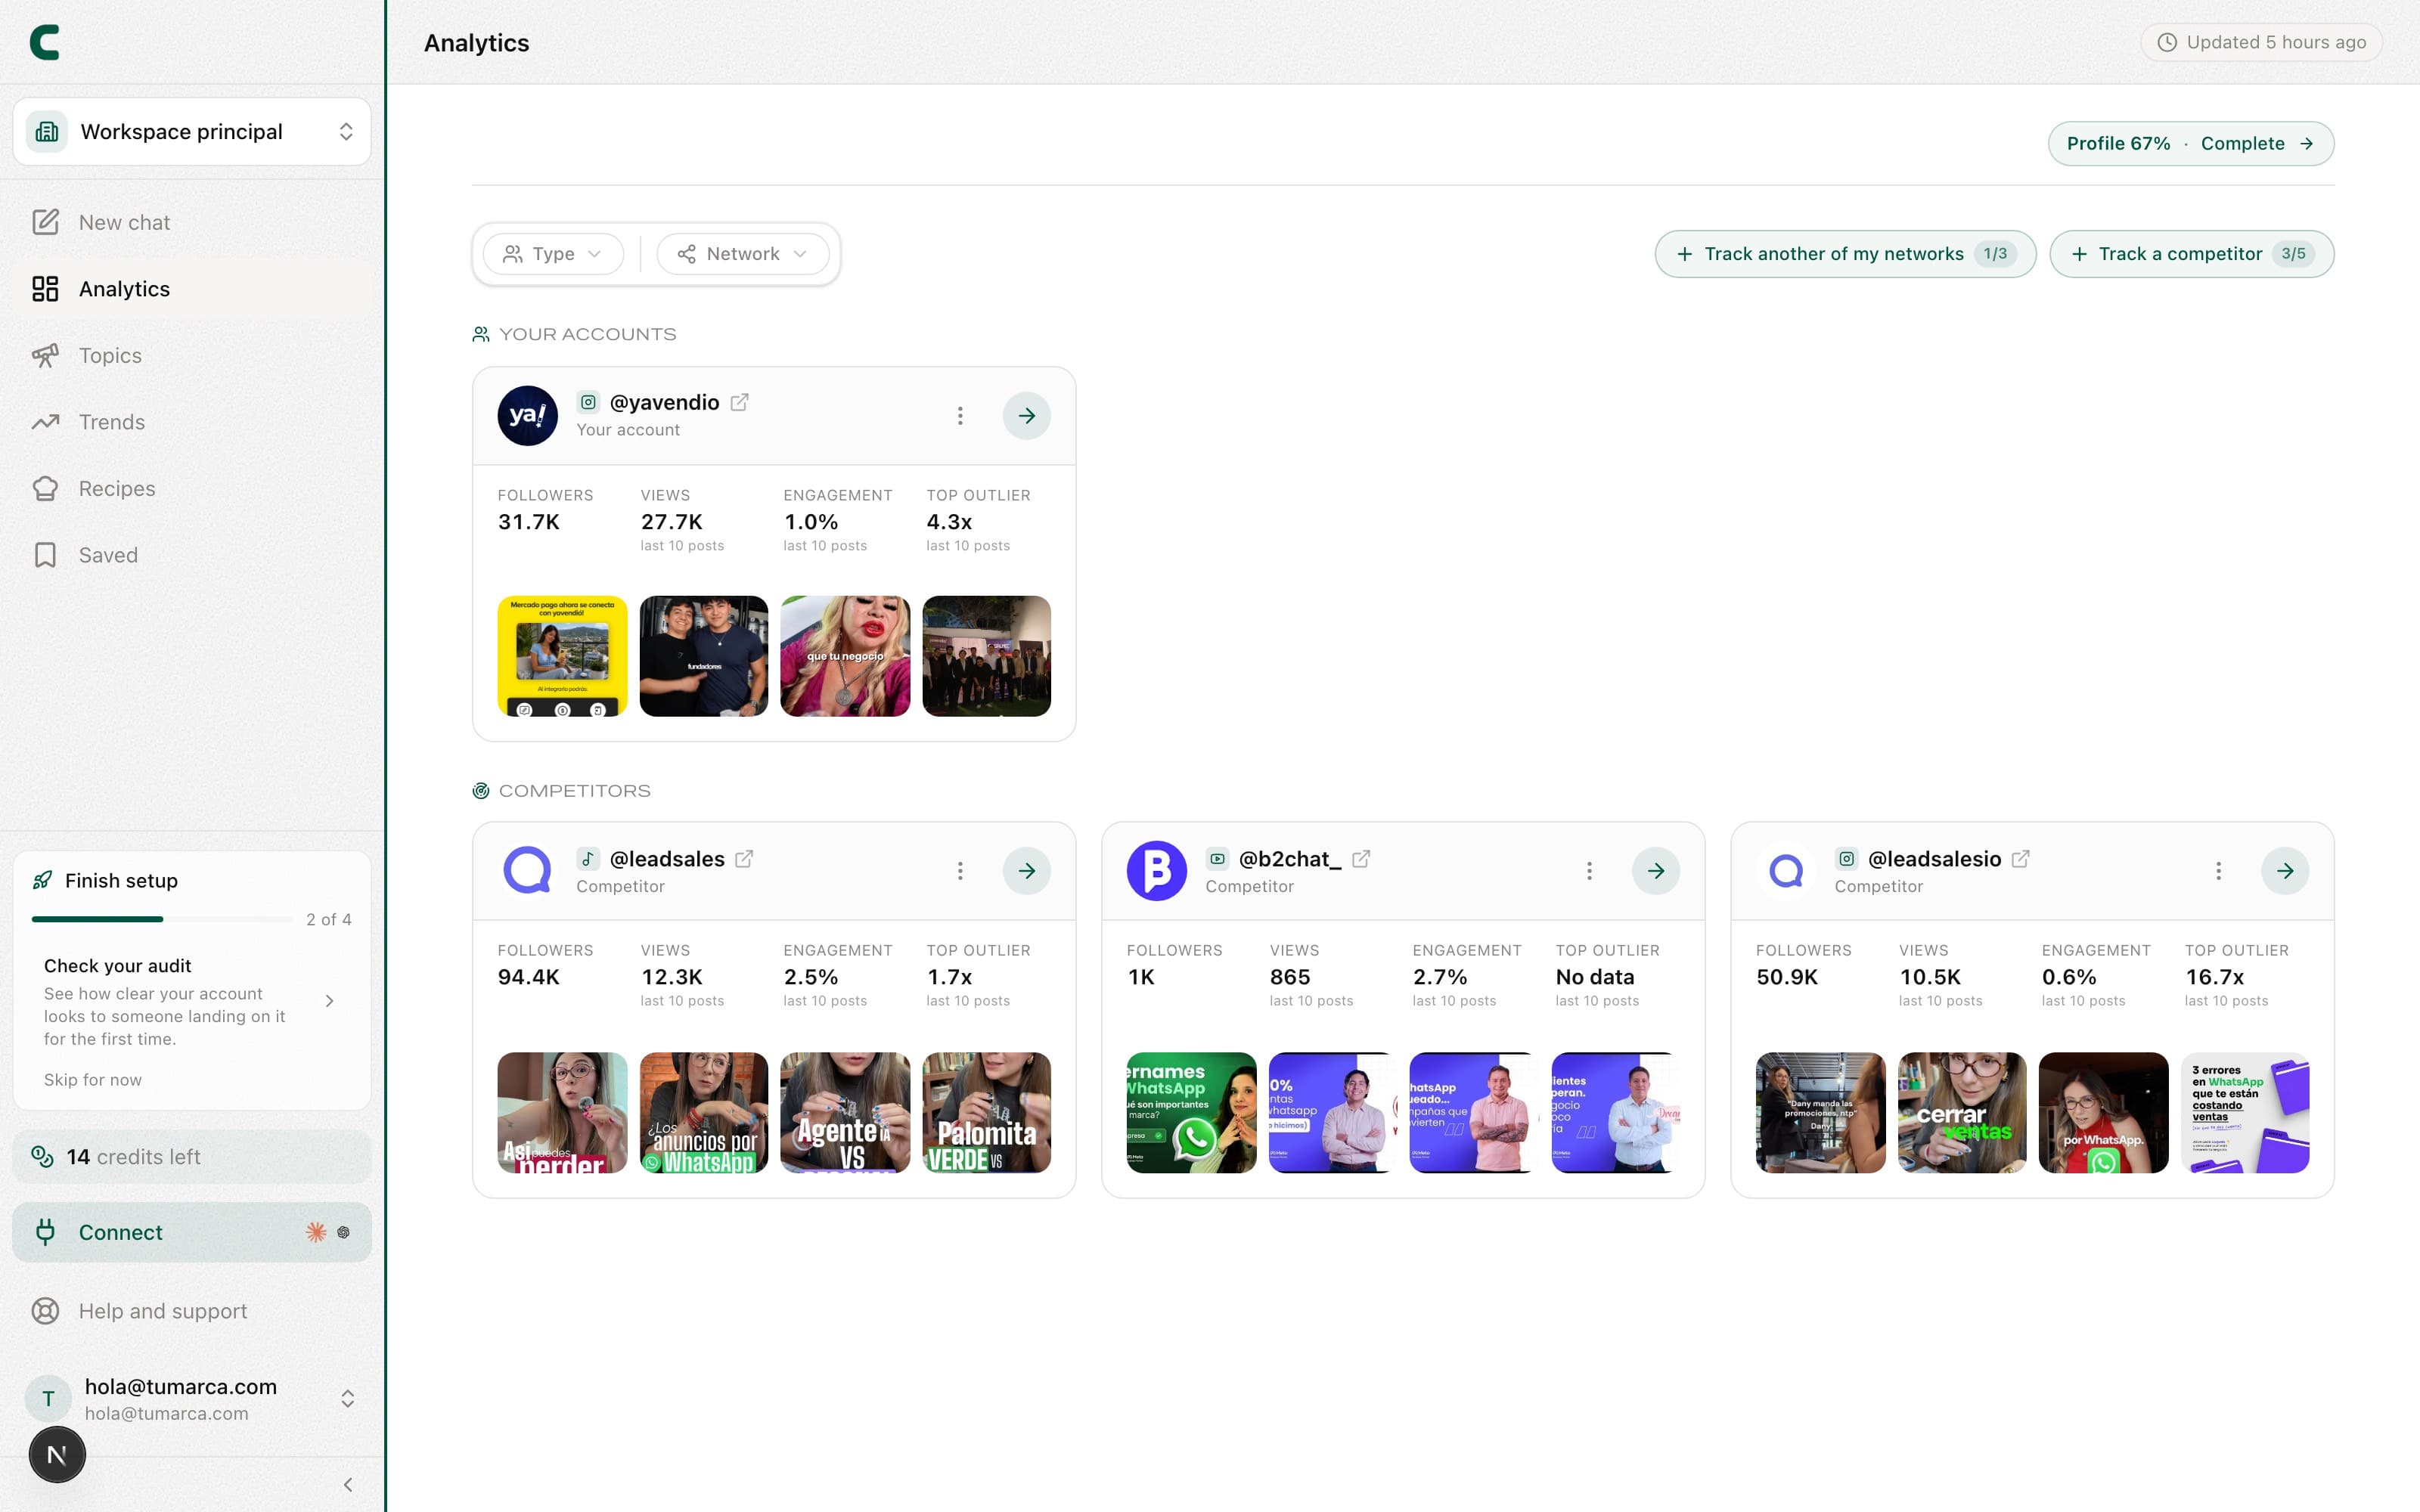
Tracking is your home, and the first thing you see is the accounts directory: one card per network of yours and per competitor you track. From there you drill into any account's full analytics. Everything is computed automatically from real posts, no manual reports.
The directory: your accounts and your competitors
The directory has two sections, Your accounts and Competitors. Each card gives you that account's pulse at a glance:
- The avatar and @handle with its network icon and a link to the profile.
- 4 metrics from its last 10 posts: Followers, Views, Engagement and Best outlier.
- 4 thumbnails of its recent posts.
- An arrow to open the account and a three-dots menu to stop tracking it.
Above the directory you get Type and Network filters. At the end of each grid there is a button to grow your radar: Track one of my networks and Track a competitor. Both show the SAME counter, and that is not a bug: your own accounts and your competitors' draw from a single pool, so they are two actions on one budget.
Inside an account
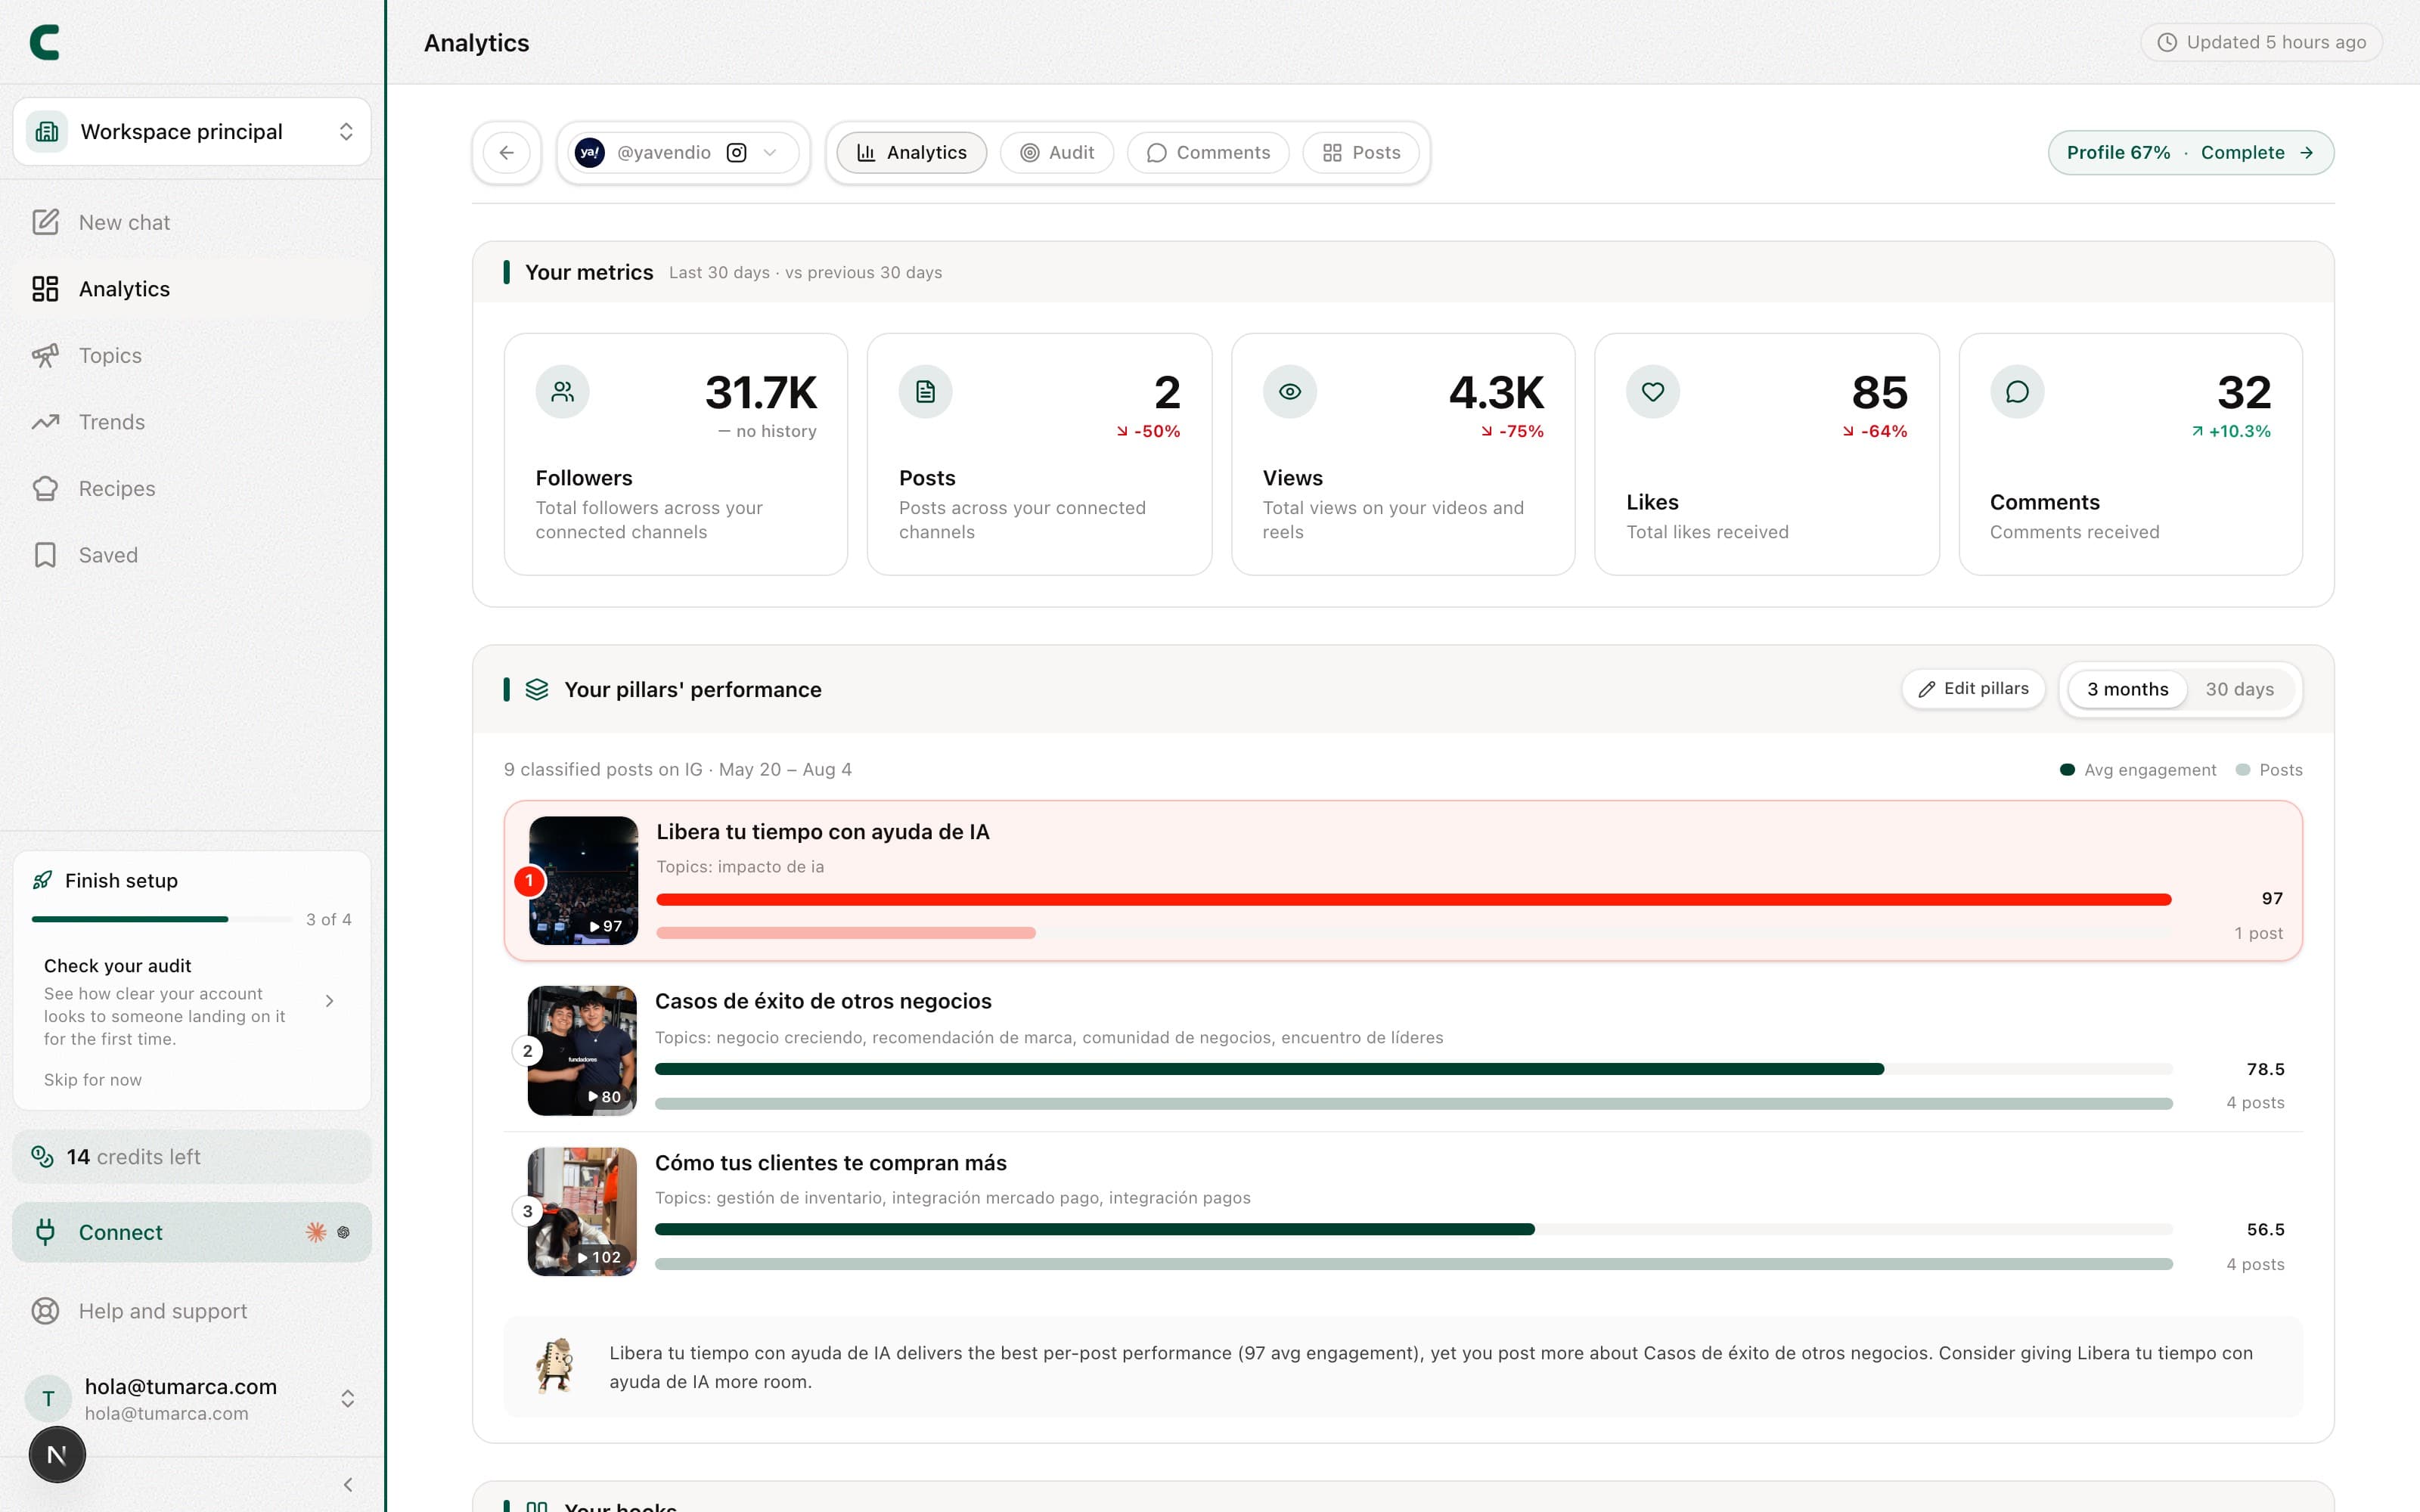
Opening a card takes you into that account's view, with three controls at the top:
- The back arrow, which returns you to the directory.
- The account switcher, to jump to another account without going through the directory.
- The view tabs: on your own accounts they are Overview, Audit, Comments and Posts; on a competitor they are Overview, Comments and Posts (the Audit is only for your own accounts).
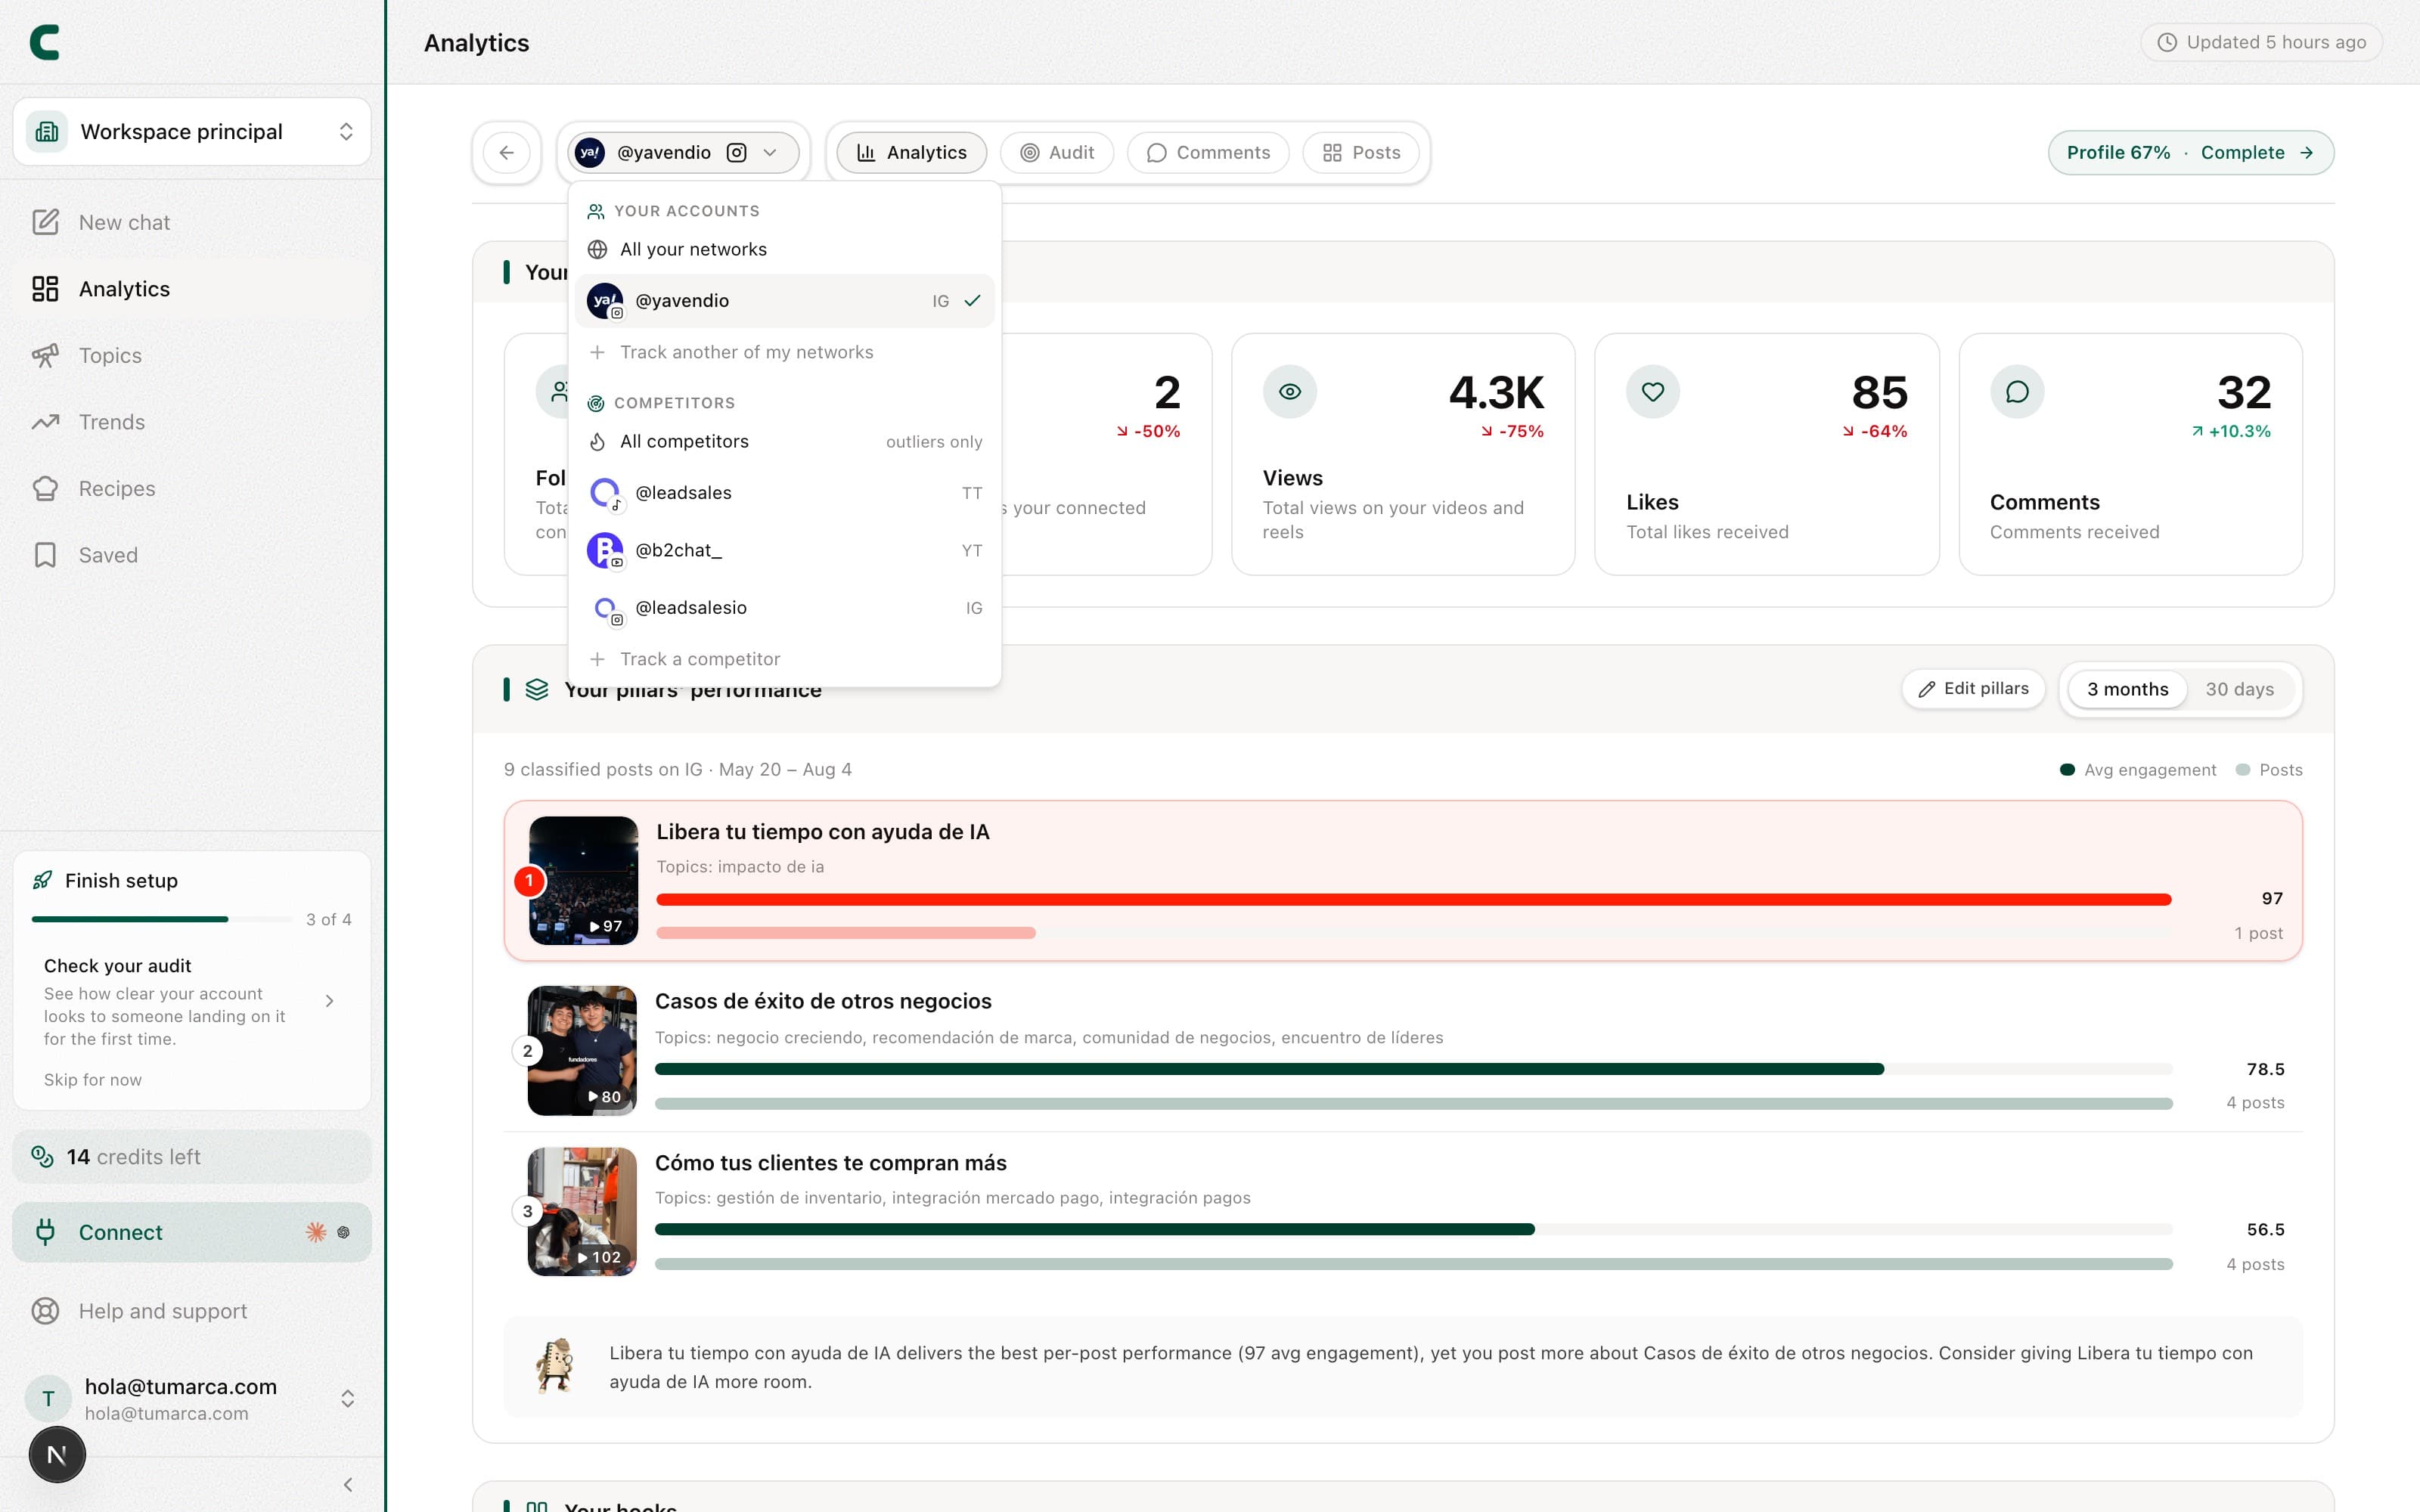
In the switcher, your networks sit on top and your competitors below, each with its avatar. It also has two special rows: All your networks, which aggregates your own accounts, and All your competitors, which gathers the outliers of everyone you track.
The profile-completeness pill ("Profile X% · Complete") only appears on your own accounts' screens, never on a competitor.
What you'll find in the Overview view
Everything you see is computed from the selected account's data, never a blend:
- Its numbers: recent followers, posts, views, likes and comments.
- Pillar performance: how each topic performs on that account.
- Its hooks: which openings work best for that account.
- Best posting hours, based on how its own posts performed.
- Formats and duration: its photo/video mix and how long its videos run.
- Its outliers: posts that beat that account's average by a wide margin.
- Topics it stopped touching and posting consistency (on your own accounts).
A freshly added account with no data yet shows honest empty states, with Scouty inviting you to get started. You'll never see another account's data filling the gap: if a section is empty, the analysis is still running.
How to read it: start at the directory for the overall pulse, open the account you care about and walk through its tabs. When you want to compare, switch accounts in the switcher and read the same panel on a competitor.
Was this article helpful?
Related articles
- How to read your account auditThe Audit scores each of your accounts from 0 to 100: how your profile reads to a first-time visitor and how well you're executing, with a checklist and a tip for every subscore.
- How to explore your postsEvery account's Posts view shows its full grid with performance tags, filters and sorting, and on each post the buttons to generate its analysis or transcript.
- How to read the "Your hooks" box"Your hooks" ranks the top 5 hook types of the account you're viewing, measured against its own median. Drill into any of them to see the example posts.
- How to track your competitors and see what works for themTrack competitors from the Tracking directory and each one gets its own full analytics: their pillars, hooks, posts and comments. And an all-competitors view shows you just their outliers.
Didn't find what you were looking for?
Reach us from the app via the Help button at the bottom of the menu and we'll reply by email.